The comparison methods desk
Semaglutide tolerability comparisons: why event rates and patient risk differ
Understanding a tolerability comparison starts with its units: what was counted, how time entered the denominator, and which question the result can answer.
Published · 12 minute read
A medication comparison can look straightforward until its numbers are examined closely. A count of events, a percentage of people and a rate measured against observation time describe different things. Reading them as interchangeable can turn a technically accurate result into an answer to the wrong question. The first task is to preserve the identity of the quantity being compared.
This analysis uses semaglutide tolerability research to explore that measurement problem. The figure presents the reported quantities; the discussion examines what would be needed to interpret, extend or compare them. The central distinction is between describing the frequency of recorded occurrences and estimating a person's chance of experiencing an outcome. Making that distinction explicit is essential before drawing conclusions about different medicines.
Wide tables can scroll horizontally. Keyboard users can focus a table region and use the arrow keys to move across it.
Reading the evidence
- Define the quantity
- An event rate and the risk of any event answer different questions.
Sources: [1]
- Keep time visible
- Person-time represents eligible observation, not a head count.
Sources: [1]
- Retain individual structure
- A total cannot reveal how occurrences are distributed across people.
Sources: [1]
- Explain aggregation
- A weighted summary requires its own interpretation and target population.
Sources: [1]
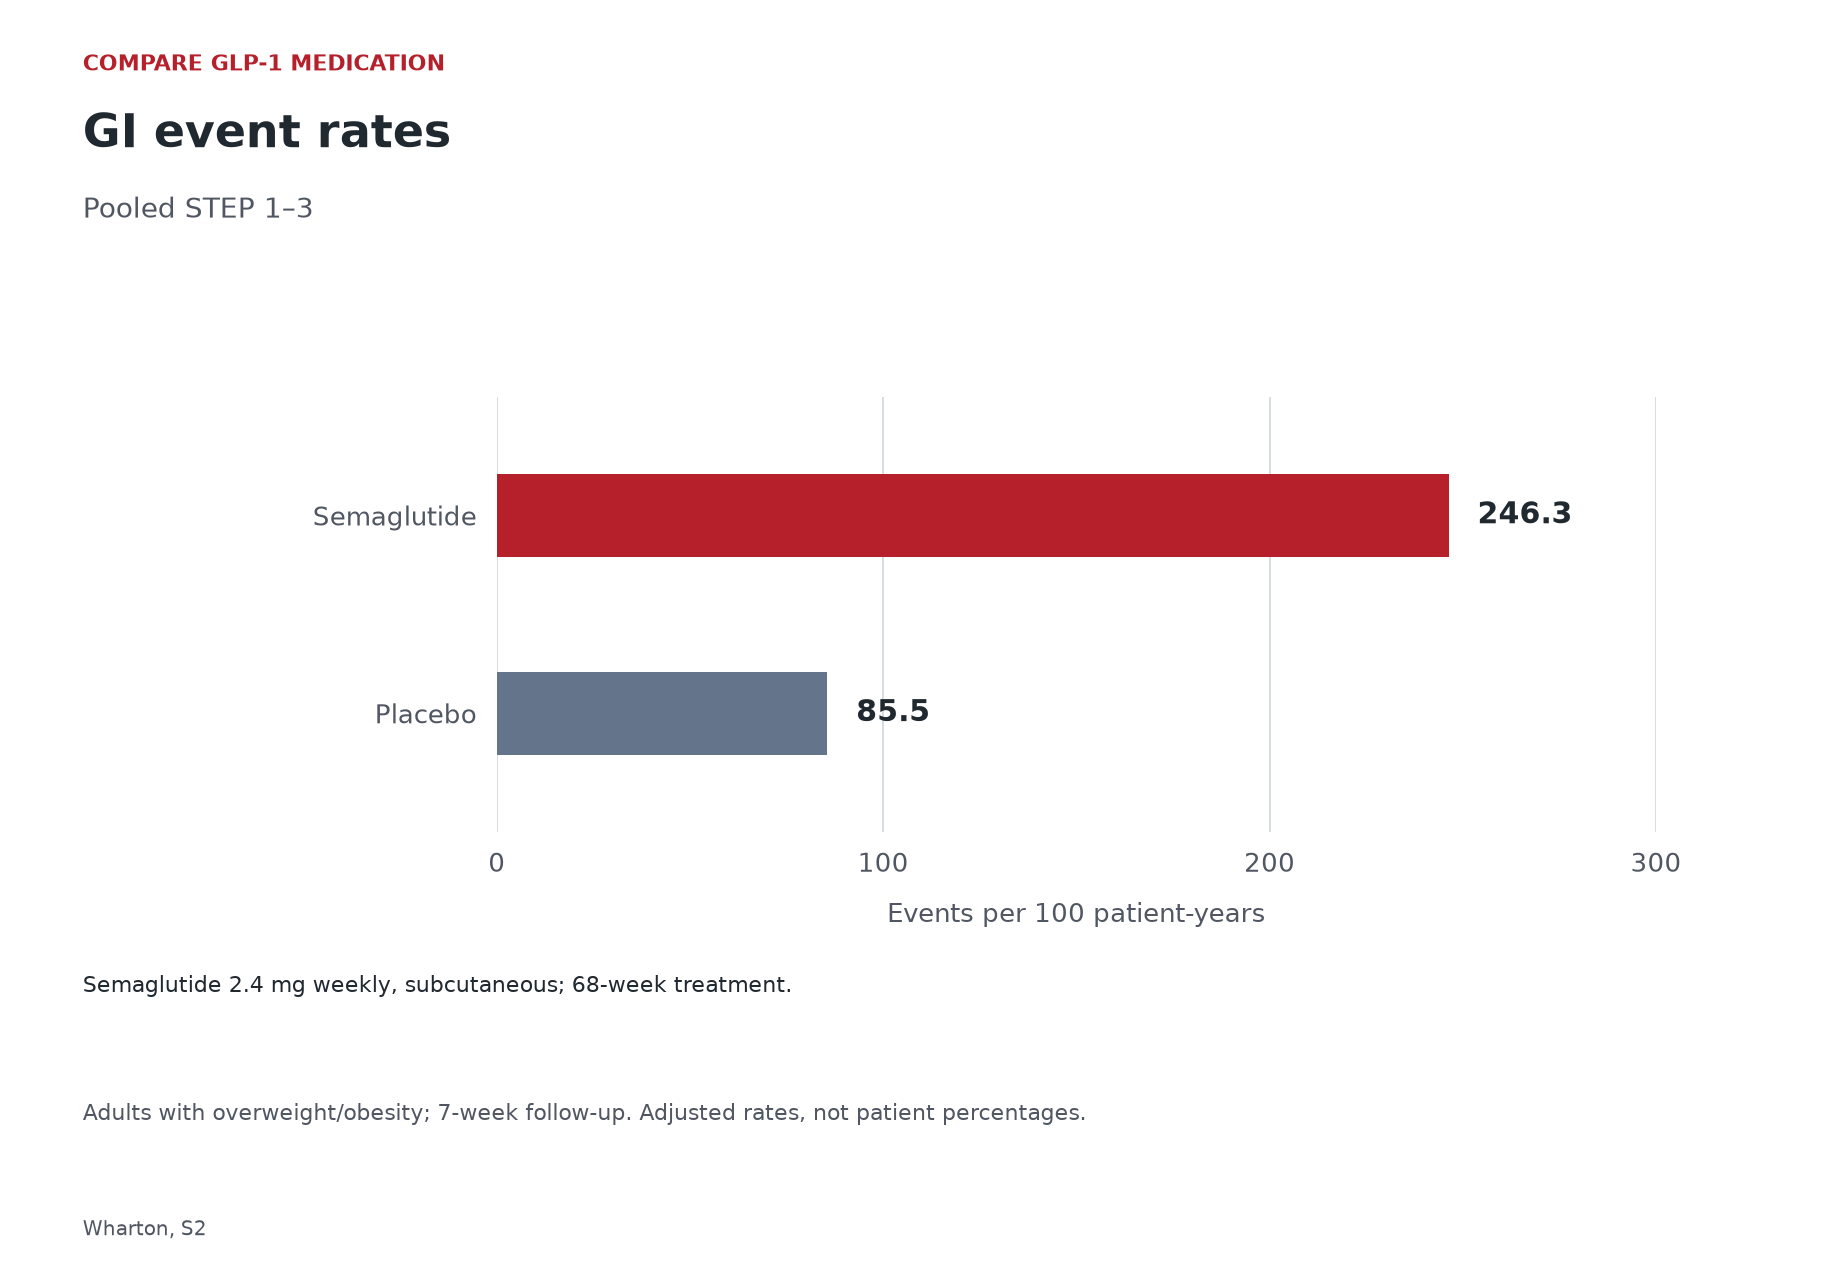
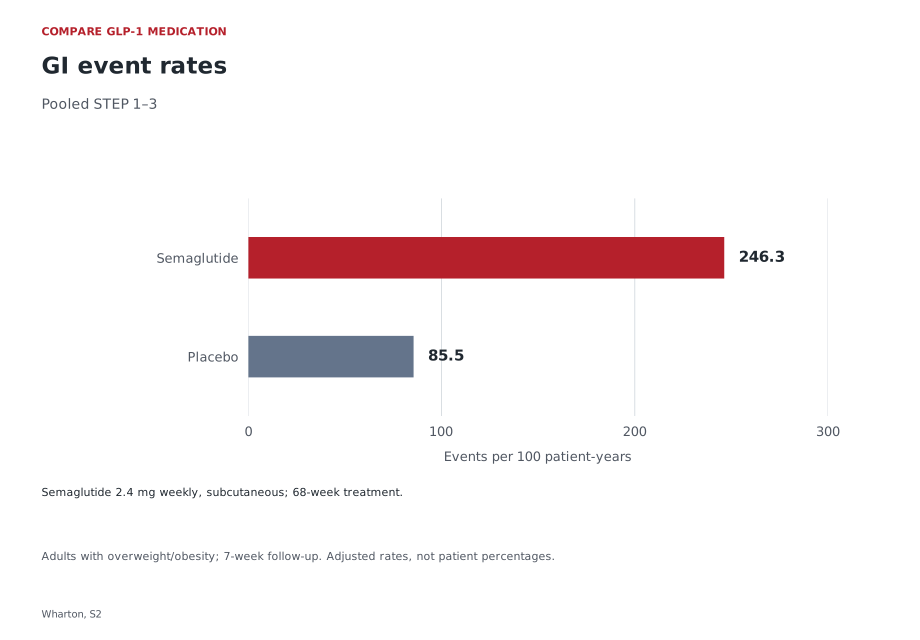
GI event rates
Pooled STEP 1–3
Semaglutide 2.4 mg weekly, subcutaneous; 68-week treatment.
Adults with overweight/obesity; 7-week follow-up. Adjusted rates, not patient percentages.
Sources: [1]
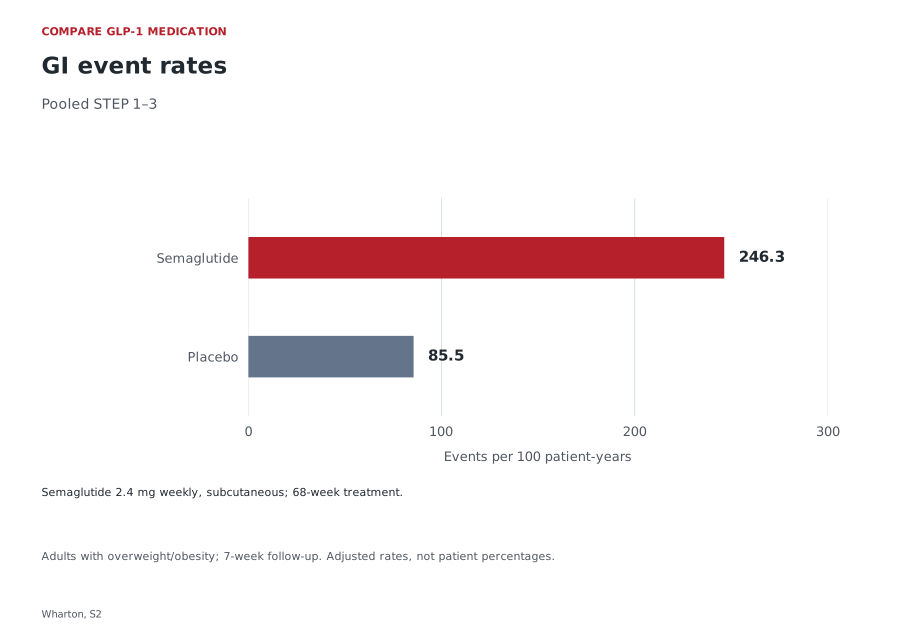
| Arm | Events/100 patient-years |
|---|---|
| Semaglutide | 246.3 |
| Placebo | 85.5 |
Start with the event-rate question
Post hoc analysis funded by Novo Nordisk, with employee authors. Diabetes eligibility differed across trials. Cochran–Mantel–Haenszel weighting adjusted event rates. On-treatment events qualified if a dose occurred within the preceding 49 days.
A tolerability question needs an outcome before it needs a comparison. Asking how often recorded events occurred during observation is different from asking whether a person experienced any event. The former can preserve repeated occurrences; the latter groups people according to whether they crossed a specified threshold. Neither question is automatically more useful. They describe different aspects of a treatment experience, and a conclusion becomes misleading when it silently moves from one to the other.
Think of an estimate as an answer with its question still attached. The event definition supplies the numerator, the observation rules supply the denominator, and the treatment alternatives define the contrast. Our companion analysis of comparator design examines that last element. Here, the central problem is dimensional: an event tally measured against time cannot become a count of affected people simply because both summaries concern tolerability. A valid comparison must preserve what each number actually represents.
Person-time is a denominator with a history
Person-time combines eligible observation contributed by different people. It describes how much time enters an analysis, rather than the number of distinct individuals who entered a study. Two datasets could contain the same membership but different observation histories. Conversely, equal totals of observation could conceal different mixtures of short and long contributions. The denominator therefore needs an accounting rule: when contribution begins, when it ends, and which intervals qualify for the particular outcome.
A time unit also determines how a rate is expressed. Rescaling an estimate into annual units does not establish that every participant contributed a full year or that events occurred uniformly across that year. A summary can describe an overall frequency while leaving the timing of that frequency unresolved. An analysis of changing event intensity would need information indexed to time, together with a defensible way of handling the people still under observation at each point.
The research objective determines which observation matters. Distinct treatment goals require distinct outcomes, and the same discipline applies to tolerability. A question about events during exposure may need a different observation rule from a question about the experience following an initial treatment assignment. Choosing between them changes the target of the analysis. It does not merely change the arithmetic applied after collection. An exposure denominator should therefore be specified alongside the question, before interpreting the resulting rate.
Sources: [1]
Repeated events do not describe a typical patient
An aggregate tally can preserve how many occurrences were recorded while discarding who contributed them. A distributed pattern and a concentrated pattern may produce similar totals. Without the allocation of events to individuals, an overall rate cannot identify a typical patient, determine how often recurrence followed an initial episode, or describe the proportion who remained free of the outcome. These are properties of individual histories, not properties recoverable from the height of a summary bar.
Studying recurrence would require a sequence for each person, with an explicit definition of when one event ends and another begins. Otherwise, a prolonged experience and several separated experiences might enter the record differently without representing a comparable unit. Those recording rules would need examination before choosing a recurrent-event model. This is a proposal for the information such an analysis would require, not a claim about undocumented procedures in the research presented here.
The category used to record an outcome also matters. A broad label such as digestive side effects can organize information without preserving severity, duration or interference with daily activities. To investigate those dimensions, an analyst would need their own defined measurements and missingness rules. Combining them into one total may be convenient, but the total does not retain the distinctions needed to answer each question. A more detailed endpoint should add specified information, rather than simply a longer label.
Sources: [1]
Why an event rate is not a probability
A probability describes the chance that a defined outcome occurs over a specified interval. A rate relates occurrences to eligible time. Their units differ, so the same numerical-looking format cannot make them interchangeable. A probability has a bounded range; a scaled event rate can reflect repeated occurrences and has no corresponding interpretation as a fraction of people. Whether the number looks large is therefore less informative than the unit attached to it.
Converting between these quantities would require more information than the displayed rate. The target interval, the event process and the handling of recurrence would all matter. A conversion that assumes a constant process would answer a model-based question under that assumption. It would not reveal an observed participant percentage hidden inside the rate. Presenting such a conversion without its assumptions would replace a measured summary with an apparently more familiar but different estimate.
Keeping unlike measures in separate fields is a useful analytical discipline. A comparison scorecard illustrates the broader organizational principle, but a scientific comparison needs explicit outcome units as well. The entries should identify whether they summarize people, episodes, time or another quantity. If an entry cannot be translated into the same target question without additional assumptions, it should remain separate. An empty common-comparison field is more informative than a numerical match produced by relabeling.
Sources: [1]
A weighted summary preserves a particular comparison
Aggregation requires a decision about how different parts of a dataset contribute to the overall answer. An unweighted mean gives each component the same influence regardless of its size. A weighted summary gives influence according to a specified rule. These operations need not answer the same question, and neither can be interpreted fully without knowing what the weighting is intended to preserve. The resulting estimate is not necessarily the quotient of two raw totals placed beside it.
This distinction matters when considering a target population. Changing the relative contribution of groups can change the population represented by the summary, even if the underlying observations remain fixed. A clear account should distinguish the enrolled population, the analytic population and the population to which a conclusion is meant to apply. The questions in our eligibility guide provide context for why membership matters; determining statistical transportability requires additional evidence about the characteristics relevant to the outcome.
Weighting also cannot create a treatment comparison that the underlying allocation did not contain. Combining information from several comparisons does not make every treatment represented anywhere in that collection randomized against every other treatment. To support a new contrast, the analysis would need a justified connection between the relevant groups. Reporting a pooled estimate clearly is therefore compatible with leaving an active-medicine comparison unanswered. The validity of the summary and its suitability for a different question are separate judgments.
Sources: [1]
Observation time can carry information
Observation is a process, not simply an empty container in which events accumulate. To interpret an exposure-based summary, an analyst would want to know how observation started, which changes altered eligibility, and whether outcome information continued to be collected after those changes. A recorded end date identifies when information stopped contributing. It does not, by itself, explain why contribution stopped or what would have been observed afterward.
The reason for a change can matter to the intended question. If an analysis uses only selected intervals, it should explain how those intervals relate to the population and treatment strategy being described. Understanding clinical and dispensing responsibilities is a separate service question; for research, the relevant issue is who collects outcome information and under what observation rules. These distinctions prevent a contact arrangement, a treatment record and an analysis denominator from being treated as interchangeable evidence.
A proposed sensitivity analysis should target a specific uncertainty. Researchers might ask how conclusions depend on an alternative observation definition or on different assumptions about unavailable outcomes. Such analyses would need justified scenarios and enough information to distinguish a plausible alternative from an arbitrary adjustment. Without that work, neither the direction nor the size of an observation-related bias follows from knowing that follow-up was incomplete. A transparent unanswered question is preferable to an unsupported correction that appears precise.
Sources: [1]
Match the quantities before comparing medicines
Before comparing medicines, place their summaries into a common measurement framework. Outcome name alone is insufficient: the unit, collection method, target interval and treatment strategy also need alignment. The table separates quantities that can all describe tolerability while retaining different information. A comparison becomes more interpretable when its conclusion uses the same quantity on both sides. If the quantities differ, the task is to obtain compatible evidence or explain the assumptions required to connect them.
The broader semaglutide and tirzepatide comparison concerns medication choice, whereas the methodological task here is narrower. An indirect comparison would need a defensible account of how the populations and study conditions connect. Characteristics that change the relative treatment effect are especially relevant to that connection. Similar average descriptions do not establish that their distributions are interchangeable, and an observed difference between studies does not identify the cause of that difference.
The intervention also needs a precise definition. Considering oral and injectable formulations makes clear why an ingredient name is not a complete research specification. An analysis would need to identify the actual strategy being compared, including its route and the rules governing treatment changes. These are design requirements, not evidence that two particular formulations differ by a measured amount. A scientifically useful comparison should state what remains unaligned instead of treating a familiar drug name as sufficient equivalence.
| Quantity | Information it retains | Information it does not supply |
|---|---|---|
| Risk of at least one event | Whether a defined outcome occurred within a specified interval | How many subsequent occurrences followed |
| Event rate | Occurrence frequency relative to eligible observation time | The distribution of occurrences across people |
| Duration summary | A specified feature of measured episode lengths | A complete account of frequency or severity |
| Severity classification | An outcome assessed against a defined severity scale | How long the outcome lasted or how often it recurred |
What an active-comparator study would need
A randomized comparison between active alternatives can address a different question from separate comparisons against a control. Its advantage depends on the allocation matching the intended alternatives. It still needs a defined outcome, a common starting point and a plan for relevant treatment changes. The label head-to-head describes the treatment arrangement; it does not guarantee that every endpoint has been measured in the same way or that every possible clinical question has been answered.
For repeated-event research, the design should specify how new occurrences are distinguished, whether participants remain eligible after an event, and how observation continues through later changes. It should also explain whether the estimand concerns assigned strategies or a particular exposure pattern. An estimand is the precise quantity the study seeks to estimate. Defining it helps readers see whether the analysis matches the intended claim instead of inferring the question from whatever measurements happen to be available.
Uncertainty must accompany that specified quantity. The design would need a method that respects how observations are grouped within people and how the comparison is constructed. A display of point estimates alone cannot establish precision or practical importance. Planning which outcomes are primary and how additional analyses will be interpreted would also reduce ambiguity about the claims supported. These requirements describe what to examine in relevant active-comparator evidence; they do not imply that such evidence is absent elsewhere.
| Design decision | Documentation needed | Comparison it supports |
|---|---|---|
| Active alternatives | Precisely defined treatment strategies and allocation | The alternatives represented by the randomized contrast |
| Common time origin | Entry point and comparable follow-up rules | Outcomes over an aligned observation period |
| Repeated-event measurement | Occurrence definitions and continuing observation rules | Comparable recurrence information |
| Uncertainty for the estimand | Analysis method and assumptions for the target quantity | The precision attached to that specific estimate |
Current safety information answers another question
Wegovy’s current label describes severe gastrointestinal reactions and dehydration-related kidney injury. It is not recommended with severe gastroparesis. Patients are told to contact a clinician about severe or persistent digestive symptoms. This is a limited safety summary, not the full prescribing information or a personal treatment recommendation.
A population estimate cannot incorporate every feature of an individual assessment. Statistical interpretation and personal clinical evaluation therefore remain different tasks.
Sources: [3]
The next analysis should preserve the original question
A more informative next analysis begins by fixing the question in advance. Specify whether the aim is to describe any occurrence, repeated occurrence, duration or severity. Then identify the eligible population, treatment alternatives, observation interval and treatment-change strategy. These choices determine which records are needed and what kind of uncertainty must be quantified. They also make disagreements interpretable: two analyses can differ because they address different quantities, rather than because one has necessarily made an arithmetic error.
The information needed for that revision should be requested at the level where it exists. Distribution across people requires participant-level structure; timing requires an event sequence; duration requires defined start and end points. A summary rate cannot supply all of those features after aggregation. Preserving that distinction helps direct further research toward the missing measurements. The next question should earn a new analysis through its design, rather than inherit an answer from a number calculated for another purpose.
A proposed extension should also distinguish a change in the scientific target from a change in the method used to estimate it. Comparing alternative methods for the same target can test how much the answer depends on analytical choices. Comparing different targets instead reveals how the question itself changes the result. Those are both worthwhile exercises, but they support different conclusions. Stating the target for every analysis, identifying which records contribute and explaining the assumptions needed for unavailable information would make the distinction visible. That structure allows uncertainty to be investigated without treating every difference between estimates as evidence of inconsistency.
Sources: [1]
Questions about the evidence
What should be checked first when two tolerability numbers use different units?
Identify the quantity each number estimates before comparing their size. One might classify people by whether an outcome occurred, while another counts occurrences relative to observation time. The shared outcome name does not remove that distinction. A valid comparison needs compatible units and target intervals, or an explicit model connecting them with assumptions that can be examined.
Sources: [1]
Can an overall rate show which participants had repeated events?
No. The rate summarizes occurrence frequency, while the distribution of recurrence belongs to individual histories. Studying that distribution would require linked event sequences and consistent rules for distinguishing occurrences. Without those details, concentration among a subset of people and a more dispersed pattern cannot be separated from the aggregate rate alone.
Sources: [1]
Does expressing a rate in annual units imply a stable process through time?
No. A time unit is a scale for expressing the quantity, not a finding about its temporal pattern. Establishing stability would require examining when events occurred and who remained eligible for observation. A constant-process model would add an assumption; changing the unit on a displayed rate does not supply evidence for that assumption.
Sources: [1]
Why might a weighted summary differ from an ordinary average?
Weighting changes how component information contributes to the overall estimate. An ordinary average gives each component equal influence, while another rule may emphasize different contributions. Interpreting the result therefore requires the weighting objective and the population it is intended to represent. A difference between summaries is not automatically an error; it may reflect a different target question.
Sources: [1]
What would justify comparing tolerability across active medicines?
The evidence should connect the intended alternatives using compatible populations, outcomes, observation rules and treatment strategies. A direct randomized comparison can provide that allocation, but its measurement and analysis still need scrutiny. An indirect comparison needs additional assumptions about the studies being connected. Neither route is established merely by placing two published numbers in adjacent columns.
Editorial assessment
The strongest interpretation keeps the numerical summary attached to its research question. Event frequency can inform an account of tolerability without identifying an individual probability, a typical recurrence pattern or an active-medicine ranking. Moving to any of those questions requires additional measurements or justified assumptions. A useful comparative analysis should make that transition explicit: identify the new target quantity, establish how the relevant observations connect, and report uncertainty for the conclusion actually being proposed. Precision in the wording of the question is part of the scientific work.
Sources and access
- Wharton: semaglutide tolerability
Article and supplement checked.
Checked: .
- Rubino: tirzepatide tolerability
Article and supplement checked.
Checked: .
- DailyMed: Wegovy
Current label checked.
Checked: .
- DailyMed: Zepbound
Current label checked.
Checked: .